Nexus Dashboard, or ND, runs microservice applications; one of which is the Fabric Controller. To get started with ND, you must first install the application. If you had experience with prior versions of ND, there is no need to start individual services now. ND's installation has already been performed for you in the interest of time and so that you can focus on the automation and configuration aspects of ND via the northbound REST API.
In your browser, if ND is not already open, then open another instance of the browser or another tab. Copy the url to Nexus Dashboard:
At the Nexus Dashboard login screen, login using your username and password: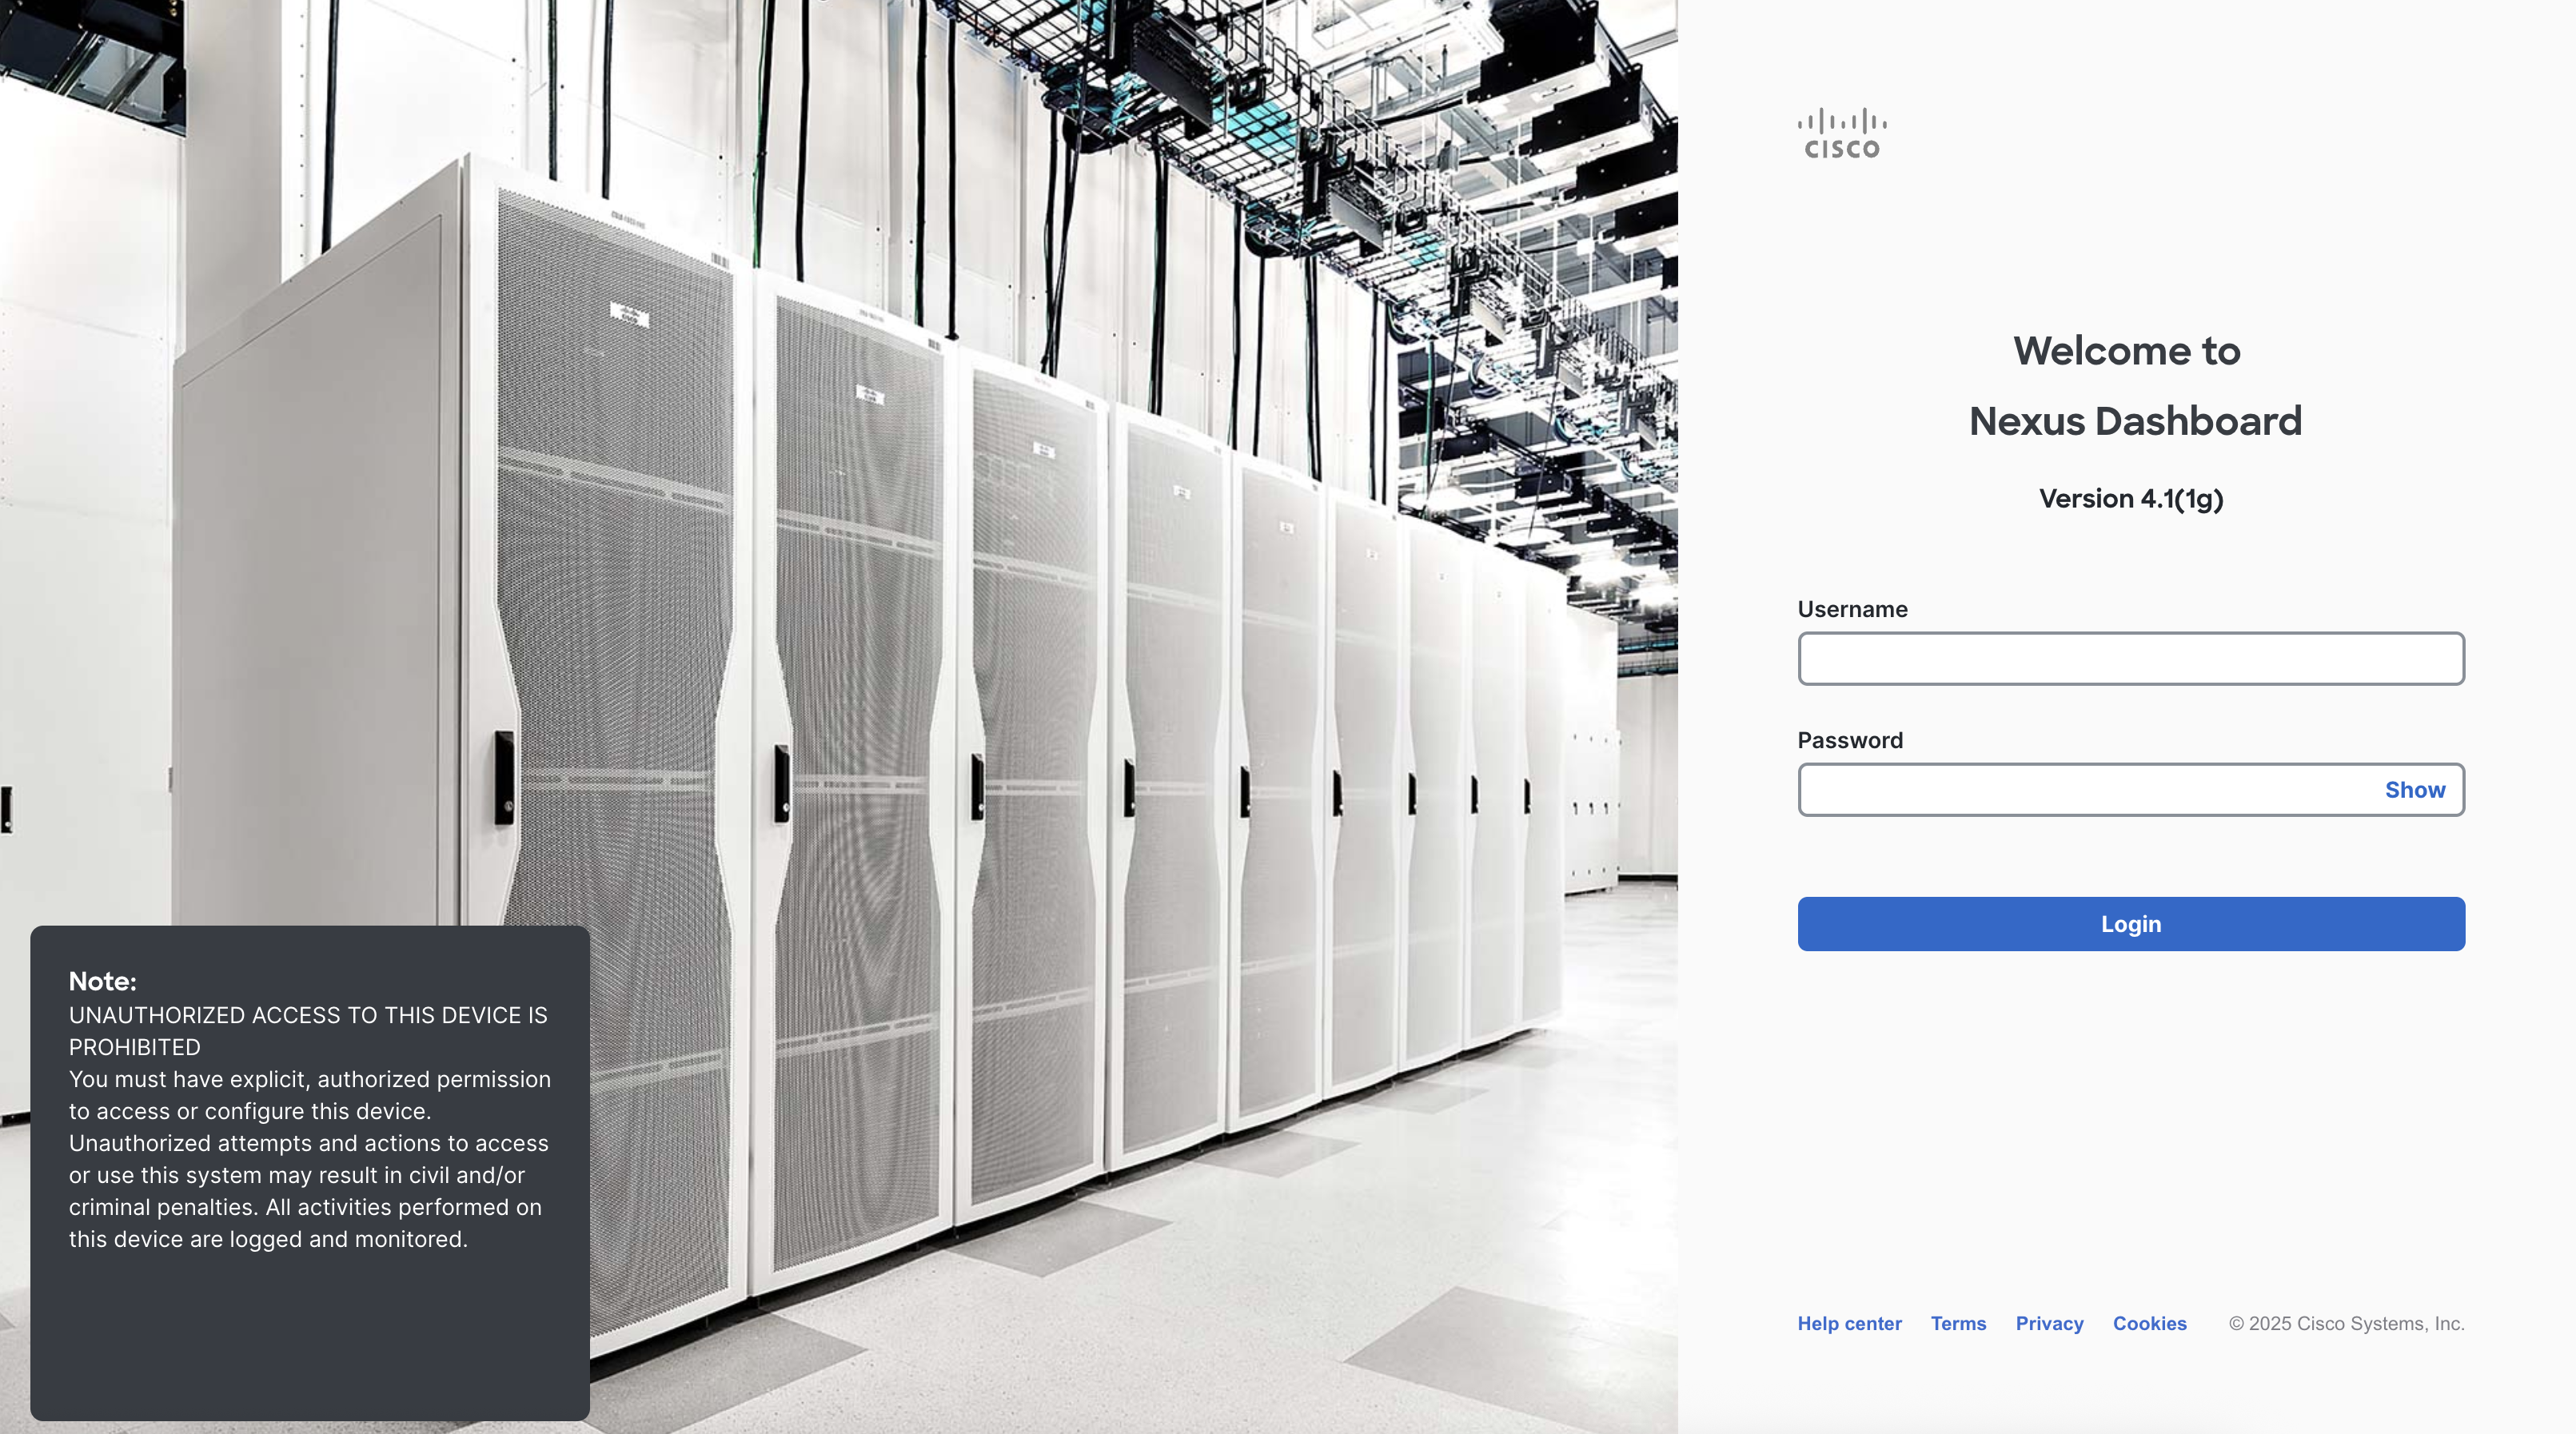
If there is a popup that appears, you can close it by clicking the Get started button.
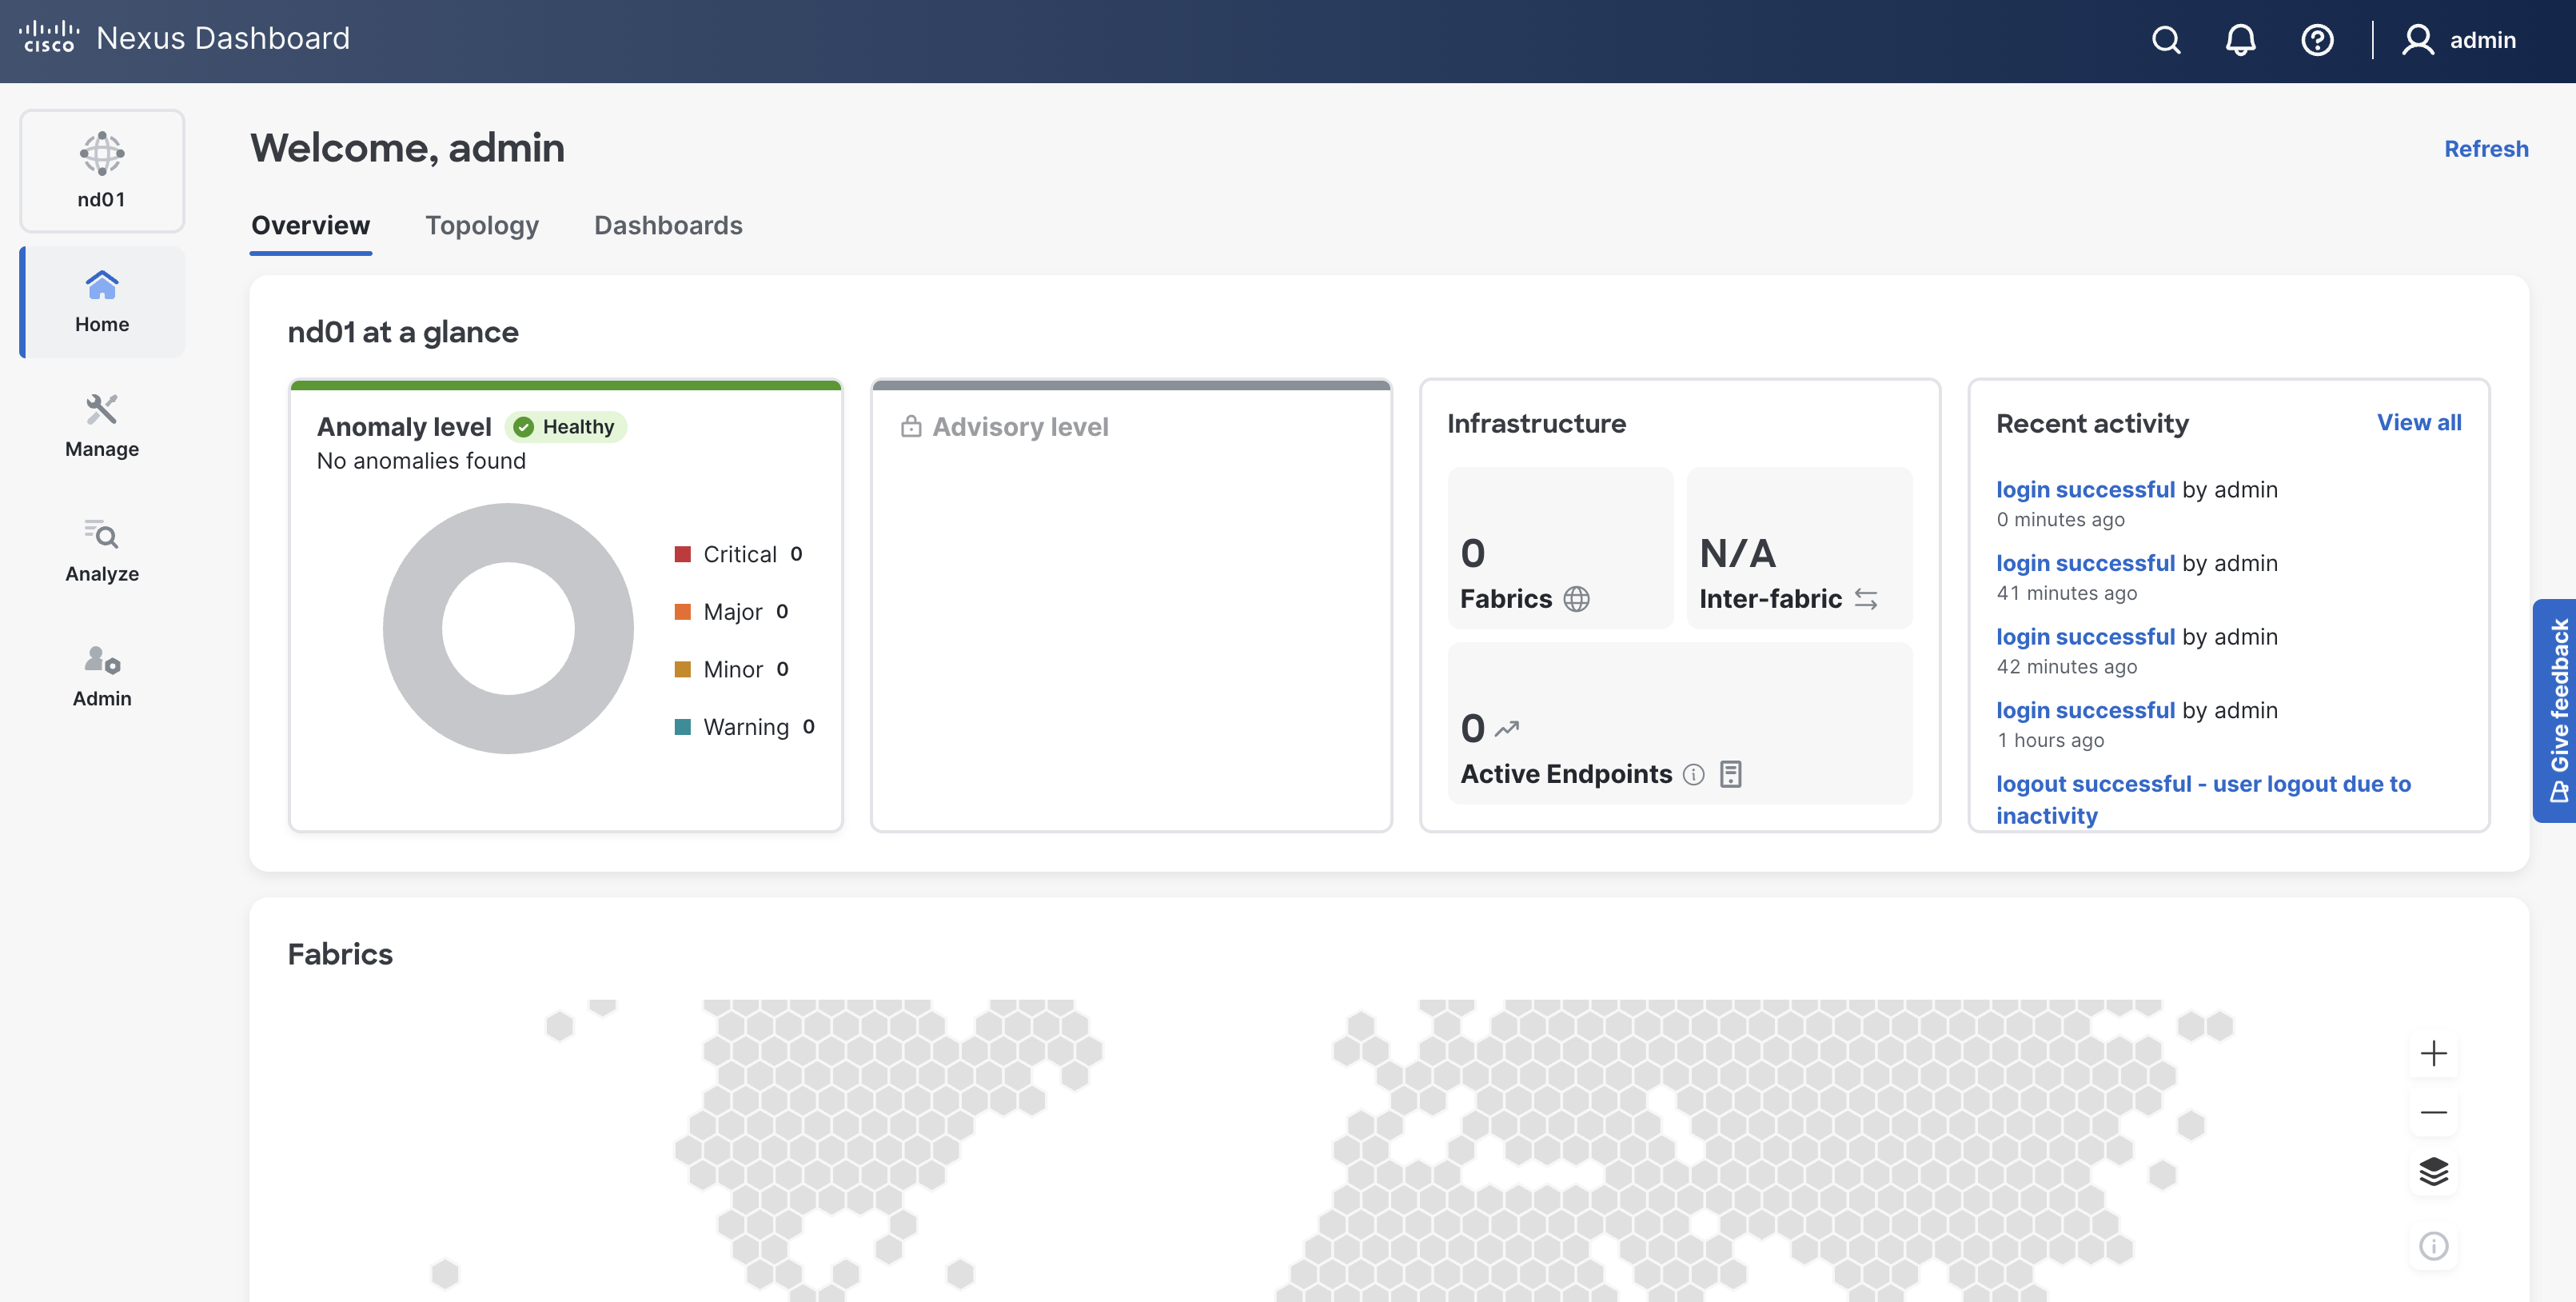
Once logged in, you will see your ND instance's home dashboard that, in a real environment, would contain information about anomolies and advisories,
infrastructure that includes fabrics and information contained in those fabrics, and a new recent activity log.
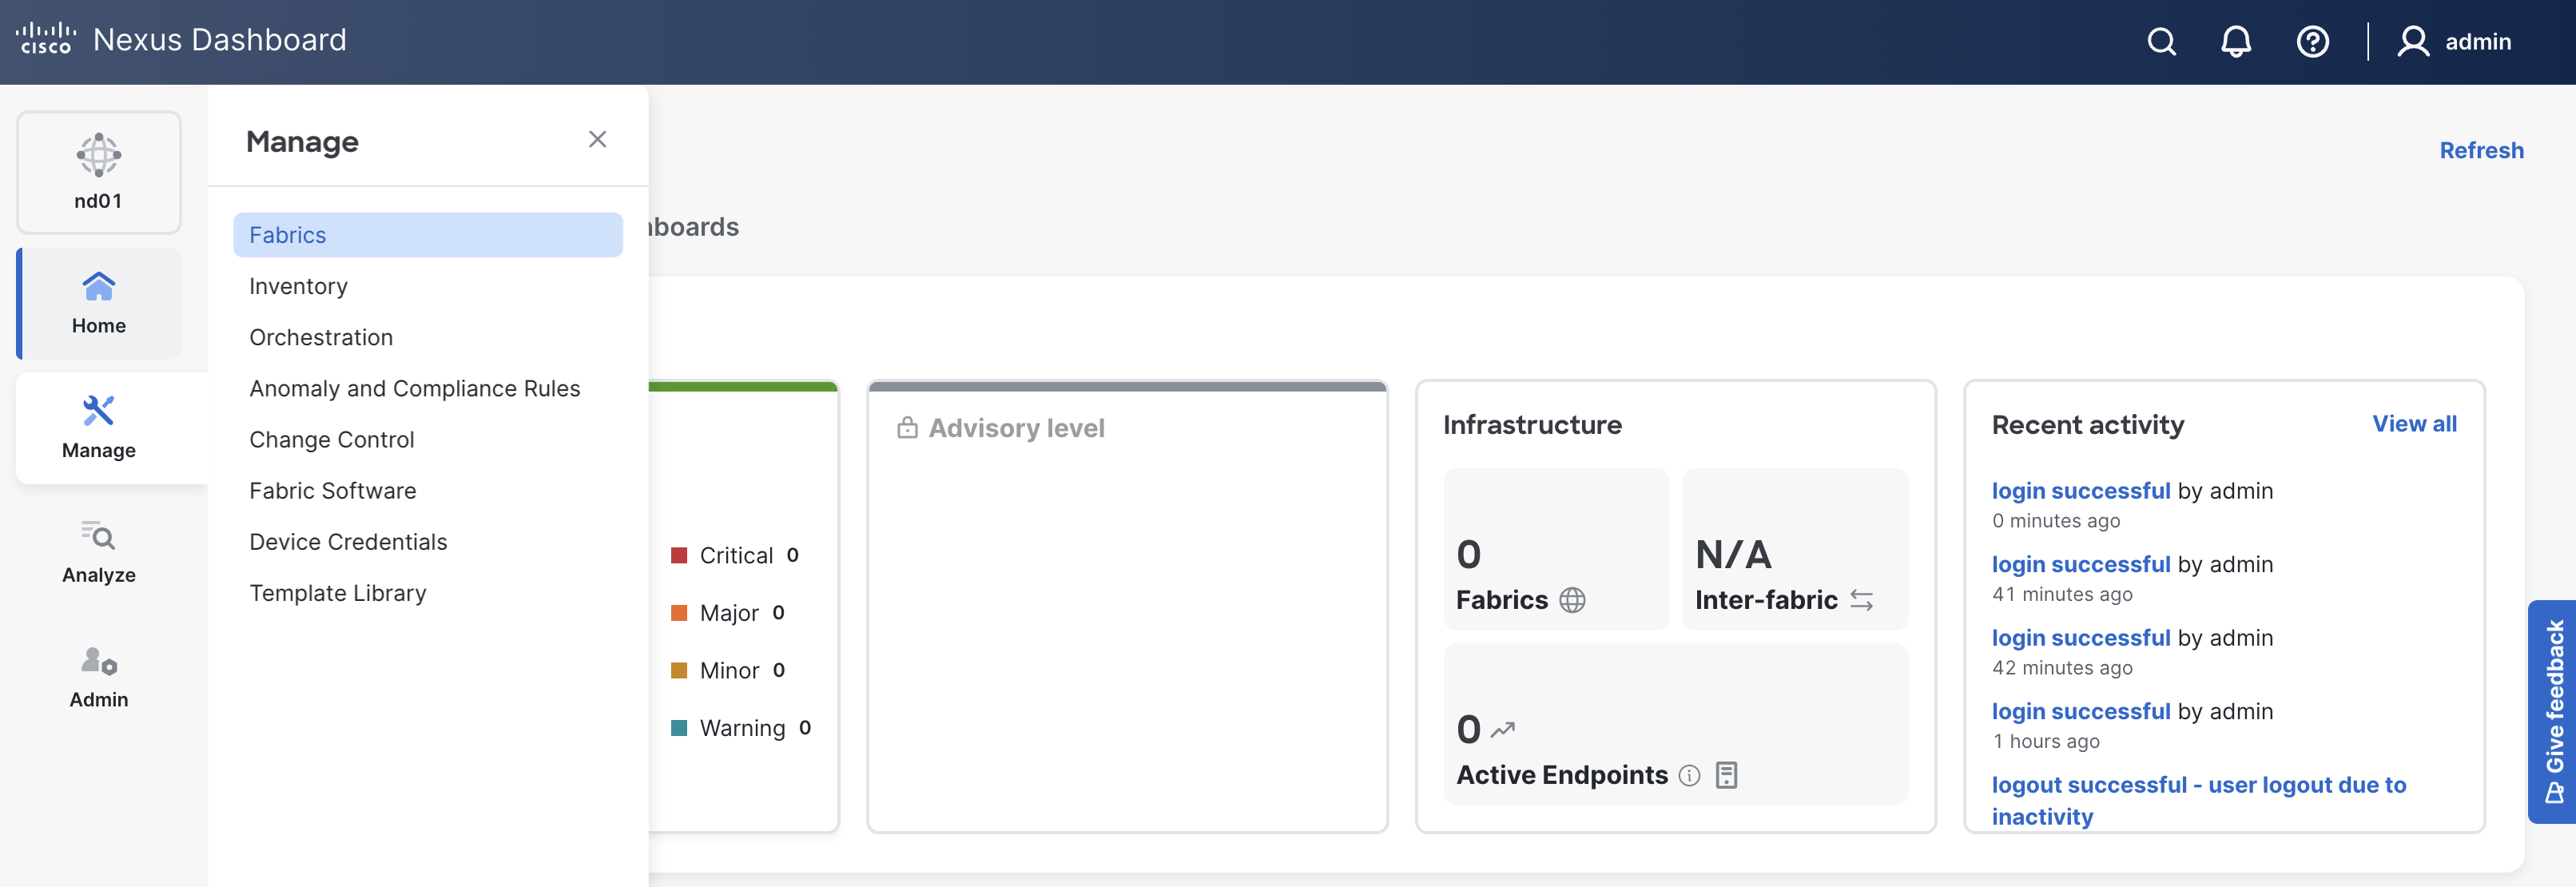
You will also see a new navigation pane on the left side of the screen. For the purposes of this lab, you will only be using the Manage section of the navigation pane.
This lab makes use a single-node virtual Nexus Dashboard (vND) app instance for lab purposes and thus has limited telemetry and monitoring functionality.
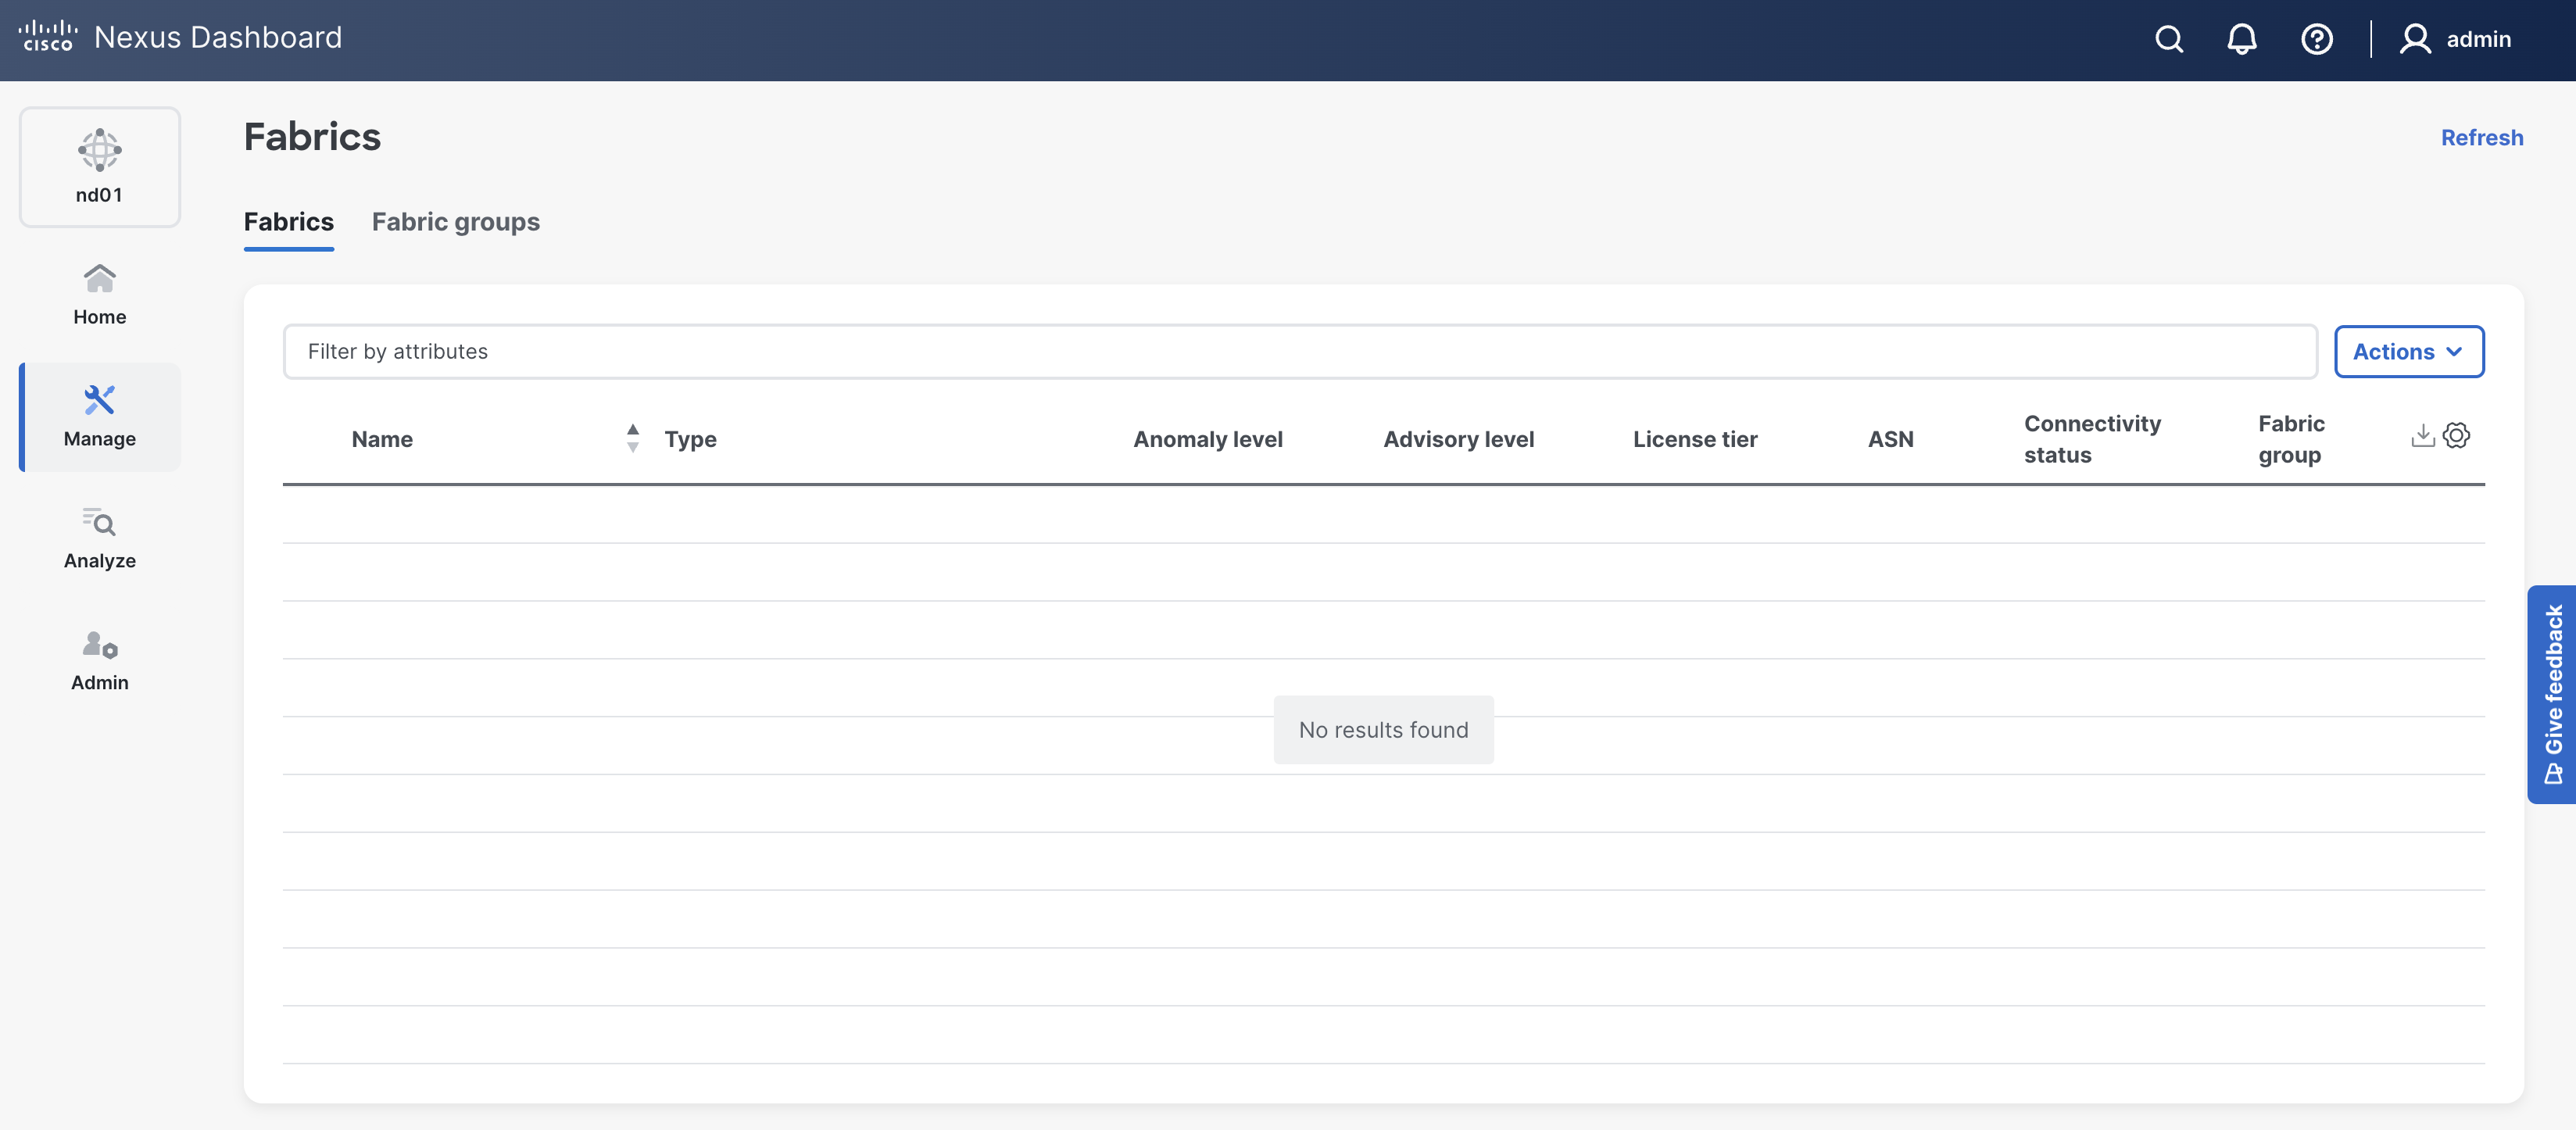
This lab will have you populate and manage fabrics through local development and then through a CI/CD pipeline and they will show up here:
When automating your network configuration workflow through NDFC, your automation should follow just about the same steps as you would normally follow in the GUI. Automation has the added benefit of both speed and reliability to your workflow!